Properties of RenderMan Noise Functions
Properties of RenderMan Noise Functions
March, 1996
Noise Basics
The RenderMan Shading Language contains a primitive function called noise, which is a kind of repeatable, continuous, somewhat-random function with known frequency response. Noise is useful in generating stochastic patterns. Almost all interesting shaders have some calls to noise.
The noise function can take different inputs, which determines the dimension of the domain of the noise function:
- noise (float) - 1-D noise
- noise (float, float) - 2-D noise
- noise point) - 3-D noise
- noise (point, float) - 4-D noise
Also, noise returns either a float, a point, or a color, depending on its context. In this sense, the function is polymorphic, and is overloaded based on its return type (something that cannot be done in C++, so this is sometimes confusing). The compiler is usually pretty smart about how to do the overloading, but you can also explicitly ask for a particular return type (this is strongly recommended to make your shader source unambiguous):
- f = float noise (...)
- p = point noise (...)
- c = color noise (...)
The RenderMan spec says that noise is based on Ken Perlin's noise function (described in his SIGGRAPH '85 paper). RenderMan noise has values that lie between 0 and 1, and is exactly 0.5 at integer lattice points.
Other than that, however, the spec isn't specific. The statistics presented below are for noise as implemented in PhotoRealistic RenderMan. You may see references to "noise" in other software or literature, but the statistics presented here do not necessarily apply to those functions.
Noise Statistics
Below are data on the range and properties of RenderMan's noise() function, gathered over a large portion of the domain.
| Domain | Mean Value | Min Value | Max Value | Std Dev |
|---|---|---|---|---|
| 1-D: noise(f) | 0.5000 | 0.2092 | 0.7785 | 0.0896 |
| 2-D: noise(f,f) | 0.5000 | 0.0894 | 0.9061 | 0.1080 |
| 3-D: noise(P) | 0.5000 | 0.0607 | 0.9541 | 0.1150 |
| 4-D: noise(P,f) | 0.5000 | 0.0333 | 0.9585 | 0.1110 |
Note that none of the noises ever really reaches 0 or 1. In addition, 1-D, 2-D, 3-D and 4-D noise all have somewhat different ranges and standard deviations. The 1-D noise, in particular, has a much narrower range and smaller standard deviation than the others.
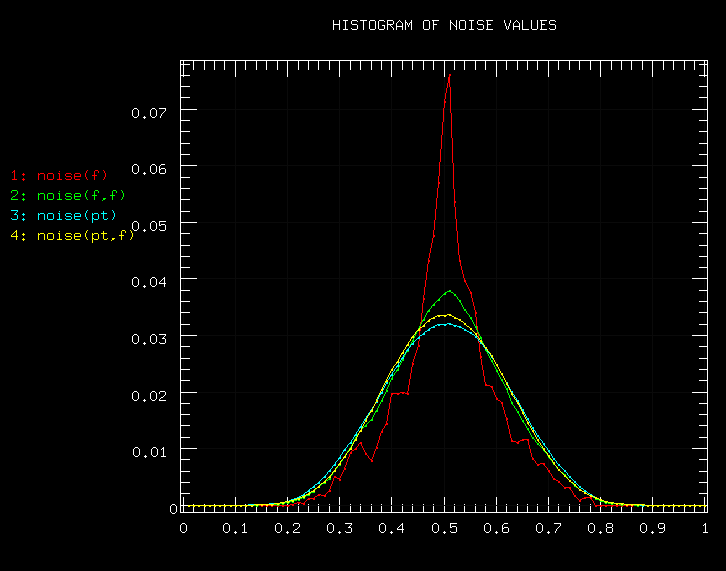
Here's another way of visualizing it. The graph below shows a histogram of noise values, giving the relative distributions of the values of noise. You can see how the value of noise is "bunched up" near its average, 0.5, especially for the 1-D case. It's almost never outside [.2,.8].

How expensive is noise?
Here are the results of some time trials. The tests timed the raw speed of noise computations. "Real life" use of noise will be a bit slower, since there's some overhead of the actual interpretation of the shaders. But it should give you a ballpark estimate of noise's cost, and a pretty good idea of the relative costs of the noise calls in each dimension. Note that each successive dimension of noise (i.e. 1-D, 2-D, etc.) takes about twice as much computation as the next lower dimension.
| Domain | Evals/sec (x 1000) |
|---|---|
| 1-D: noise(f) | 721 k |
| 2-D: noise(f,f) | 447 k |
| 3-D: noise(P) | 279 k |
| 4-D: noise(P,f) | 146 k |
Note: these figures were all for float noise. Calls to point or color noise are about 2.5 times slower.
Noise thresholding guide
Often, you want to use thresholded noise as a pattern. Typically, the Shading Language code for this looks something like:
n = noise(P);
val = smoothstep (thresh, thresh+eps, n);
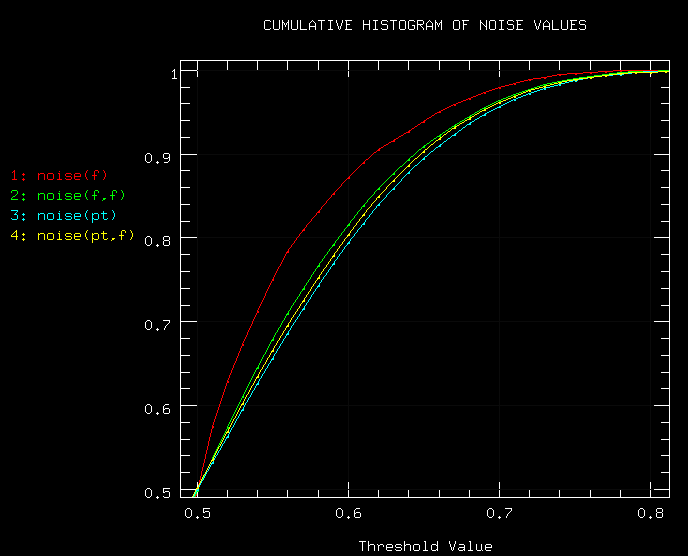
But what value do you choose for thresh if you want, say, 80% of the domain to be below the threshold value and 20% to be above the threshold value? Consult the handy dandy chart below:

The horizontal axis is the threshold value. The vertical axis is the portion of the noise domain whose noise values are below that threshold value. So, for example, you can see that for 2D, 3D, and 4D noise, if you use a threshold of 0.6, about 80% of the noise domain will have values below the threshold. As explained earlier, the 1-D notes has quite different properties. For 1-D noise, you would need a threshold of about 0.56 to give you the 80/20 distribution (using the same threshold of 0.6 would give you about an 87/23 distribution for 1-D noise). Two- and three- and four-D noise are close enough to each other that you can assume they use the same thresholding. The graph is nearly symmetric about (0.5,0.5), so only the "upper" portion is reproduced here. So, for example, to get 20% below the threshold value and 80% above, you would use a threshold value of 0.4. Note that all of the noises are almost never greater than 0.8 (or less than 0.2).
Frequency characteristics of noise
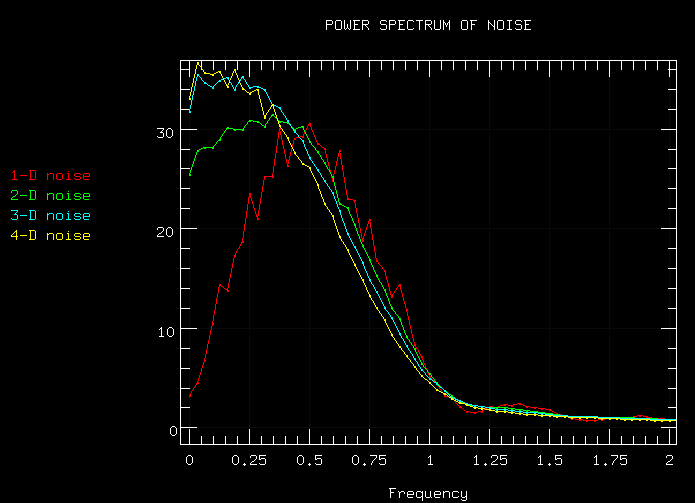
Rather than keep you in suspense, here's a power spectrum of noise:

Executive Summary: All the noises have a dominant frequency somewhere around f = 0.5. They do a pretty good job of not having frequencies much higher than 1.0, and very few greater than f = 2.0.
The power spectra above are the averages of power spectra taken of 1000 randomly chosen spans of noise in n-D space. The apparent excess of low frequencies in higher dimensional noise is because n-D the sampled spans aren't axially aligned.
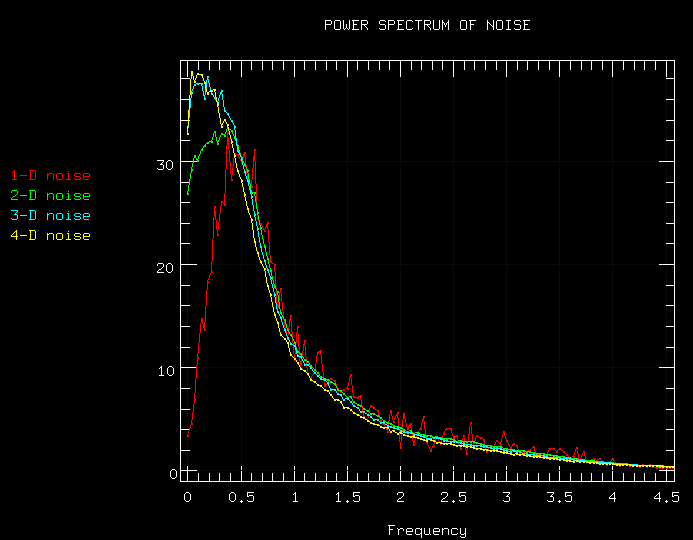
And here's the power spectrum for three summed octaves of noise (doubling the frequency and halving the amplitude each time):

Pretty darn close to 1/f!
